


 1333
1333 0
0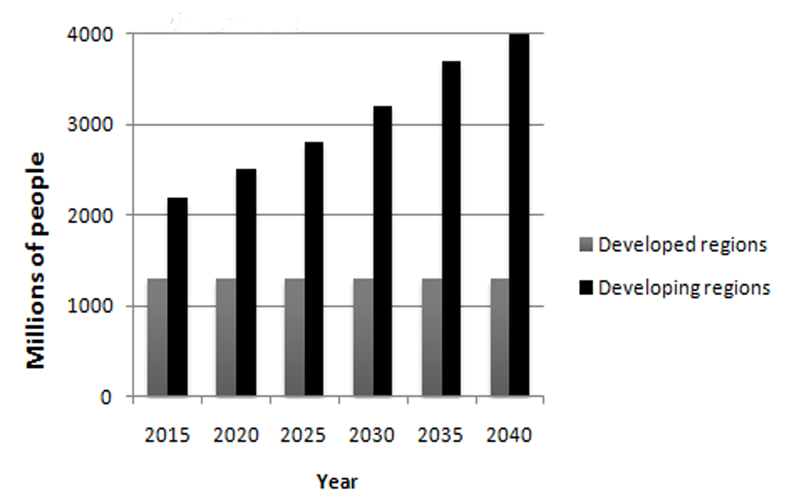
The bar chart contrasts the difference between the volume of population in developed areas and those within developing regions, measured in millions, for the years 2015 and projected onwards to 2040, calculated at 5-year intervals.
Overall, while the number remained fairly level for populations living in developed areas and substantially lower than in developing areas, the number of residents in underdeveloped lands saw an incremental increase so that this population will have increased from just under double to more than triple that of developed areas.
In 2015, the population in developing regions stood at approximately 2.2 billion people, around 0.8 billion more than those living in developed places; however, this variance grew by 0.2 billion by 2020, yet, figures for those residing in developed regions remained static. The year 2025 will also see a similar increase, with developing regions registering an even greater difference with developed area population numbers, and this trend is set to continue until at least 2040.
It is predicted that in 2040 citizens inhabiting emerging regions will number 4 billion while those in matured regions will have parity with their numbers in 2015.
范文解析在我的同名公众号:英语考试Cat

欢迎朋友们加入我们的【知识星球】
价格:388元/年。
如不适合,加入后3天内无理由退款。
